
Revisiting the demography of the 1918 influenza pandemic in Ireland
Published in Features, Issue 5 (September/October 2021), Volume 29By Chris Colvin and Eoin McLaughlin
The year 2020 witnessed the first major global pandemic in over a century. Policy-makers and analysts around the world scrambled to find meaningful historical analogies to comprehend the scale of devastation unleashed by Covid-19. Spurred by the freshness of a wide array of centenary studies published in both popular and academic presses, the most widely used analogy was the 1918–19 influenza pandemic, known as the Spanish ’flu.
In Ireland the study of the Spanish ’flu pandemic long went unnoticed by historians, as it was sandwiched between a world war and a revolution. Two dedicated monographs have been published on the pandemic in Ireland, the more widely known being Ida Milne’s Stacking the coffins: influenza, war and revolution in Ireland, 1918–19 (2018). History Ireland also explored the topic in 2009 (Biener et al.). Here we give an overview of our own recent work on the 1918–19 influenza pandemic in Ireland, published in Economics and Human Biology (2021), and outline how we think it changes our understanding of the course of the disease. In particular, we highlight the limits of the Covid-19/Spanish ’flu analogy by re-estimating the demographic impact of the two pandemics.
A review of the literature
 One of the reasons why the 1918–19 pandemic has caught the imagination of modern medical practitioners and epidemiologists is its scale. This is not without contestation; the perceived global impact of the 1918–19 pandemic has grown arms and legs over the years. Contemporaries believed that twenty million people succumbed to the virus. These estimates crept upwards over the course of the twentieth century and by the turn of the century had increased fivefold: the headline figure quoted by Biener et al. of 100 million comes from estimates by Johnson and Mueller in the Bulletin of the History of Medicine 76 (1) (2002). An influenza death-toll of that magnitude is unrealistic, however, as it implies higher average mortality rates than were actually recorded. New estimates based on all-cause excess mortality have revised the figure down to a substantial but more realistic total of 17.41 million (Spreeuwenberg et al., American Journal of Epidemiology 187 (12) (2018)).
One strand of modern historiography focuses on explaining the apparent collective amnesia surrounding the 1918–19 pandemic: why, despite these large estimated death-tolls, was the pandemic ‘forgotten’ until relatively recently? Was it a traumatic event best forgotten? Indeed, this is a line of argument taken by Beiner et al. The alternative explanation proposed by Honigsbaum in A history of the great influenza pandemics (London and New York, 2014) is that it was not striking enough to be memorable in the first place. Spanish ’flu was seen as part of the war strain and occurred in an era of lower life expectancy; dying of communicable disease was not that unusual at the time.
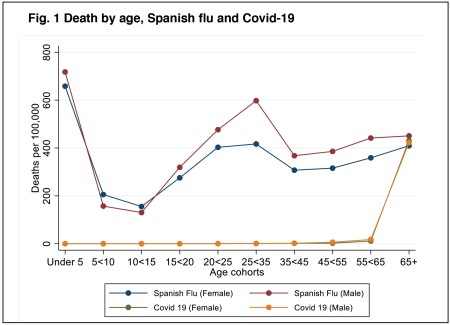
One feature of the 1918–19 pandemic that was unusual, however, was the peculiar pattern of its demographic impact. Studies from the US and elsewhere have found a ‘W-shaped’ age distribution of mortality: the pandemic saw higher-than-usual deaths amongst adults in the prime of their (working) lives, aged 20–40 (Fig. 1). By comparison, non-pandemic influenza deaths are ‘V-shaped’, hitting only the youngest and oldest.
The pandemic has proved to be something of a natural laboratory for epidemiologists, offering a chance to see how different public health policies worked in practice. In the US, the Center for Disease Control and Prevention’s (CDCP) Interim pre-pandemic planning guide (2007) argued for the widespread use of non-pharmaceutical interventions to manage new pathogens that could be resistant to pharmaceutical interventions. The interventions used to tackle the 1918–19 pandemic were part of the CDCP’s evidence base. They constitute what we would now call ‘social distancing measures’, such as closing schools and theatres, or using face masks. These helped to reduce the ’flu’s impact by reducing peak mortality and spreading the infection rate across a greater period of time (Hatchett et al., Proceedings of the National Academy of Sciences USA 104 (18) (2007); Markel et al., JAMA 298 (6) (2007)).

Above: Self-portrait after Spanish Influenza by Edvard Munch. (Norwegian National Museum of Art, Architecture and Design)
While epidemiologists have long been interested in the 1918–19 pandemic as a way of evidencing policy measures, until recently economists have been more hesitant to examine it. This is because the estimation of its economic impact is hampered by co-occurring events, especially the First World War.
The US has some of the most detailed government records available for documenting the ’flu’s economic consequences. Burns and Mitchell, in Measuring business cycles (New York, 1946), noted a recession of ‘exceptional brevity and moderate amplitude’ in 1918–19 but note that this could have been due to the armistice. Velde (Chicago Federal Reserve working paper, 2020) finds more evidence of economic impact, but also notes that the fall in employment was likely attributable to the armistice. Cross-country statistical comparisons by Barro et al. (NBER working paper, 2020) suggest economic declines in national income and consumption of 6% and 8% respectively owing to the pandemic after controlling for the impact of the war.
Spanish ’flu in Ireland
 Influenza-18 originated from an unknown source and typically arrived in countries via major trading ports—carried, among others, by military personnel. The disease diffused through populations in a process of spatial contagion along major transportation infrastructure, typically in multiple waves. Great Britain and Ireland saw three such waves, with the second, occurring in autumn 1918, being the deadliest.
Milne (2018) has published the most comprehensive study of the pandemic in the Irish context. Her narrative history recounts fascinating personal accounts from across society, describing the devastating consequences of people continuing to work through the pandemic out of poverty. She looks at public policy interventions by hospitals, workhouses and prisons, and focuses on how government managed the social and political fallout from the disease.
The pandemic also provides a backdrop to the 1918 general election that took place on 14 December, during the third wave. De Bromhead et al. (Journal of Economic History 80 (3) (2020)) have recently argued that an electoral district’s influenza mortality rate is negatively associated with voter turnout in this election.
The impact of the Spanish ’flu on Ireland was first quantified by Ireland’s then registrar-general, Sir William John Thompson, in an article published by the Statistical and Social Inquiry Society of Ireland in 1919. He estimated an influenza mortality rate of 243 per 100,000 in 1918, with urban areas experiencing a rate of 370 per 100,000. Milne and others highlight how these official figures probably underestimate the pandemic’s true impact because of misclassification of deaths, suggesting a higher pandemic death-toll—perhaps even up to 782 per 100,000.
To calculate the mortality rate requires a denominator: the relevant population. This constitutes the average population exposed to risk of death during the defined period of time. Existing studies all use the population taken from Ireland’s most recent census, conducted seven years before the pandemic, in April 1911. Using the 1911 census means, however, that we do not take account of changes in population owing to births, ageing, migration and deaths between 1911 and 1918. The population denominator currently used by historians to infer mortality rates is incorrect.
Demography matters
Our new peer-reviewed research on the Spanish ’flu makes one simple point that was absent in the existing literature: demographic composition matters for making meaningful comparisons of the pandemic’s impact. In making our point about demography, we also made three specific contributions to knowledge of the pandemic in Ireland. First, we calculated the post-censal population of Ireland in 1918 and 1919 for use as a denominator that takes account of changing demographic patterns. The most striking changes were the fall in births and the military enlistment.
Second, we borrowed an established demographic method to calculate age-standardised mortality rates, a statistic that is necessary to make meaningful comparisons across Ireland’s 32 counties. The best way to understand age standardisation is to think of two counties with disparate population structures. Take Dublin and Mayo as examples. If Dublin had a higher crude mortality rate during the pandemic than Mayo but Dublin also had a higher share of the population aged between 20 and 40, then we cannot make a comparison without controlling for this difference; the 20–40-year-olds are biologically much more likely to succumb to the ’flu in the first place. All else being equal, Dublin’s demography means that it is more at risk and the city would expect to have a higher crude mortality rate. We therefore need to re-weight the impact of Dublin’s various demographic groups to make it comparable to Mayo.
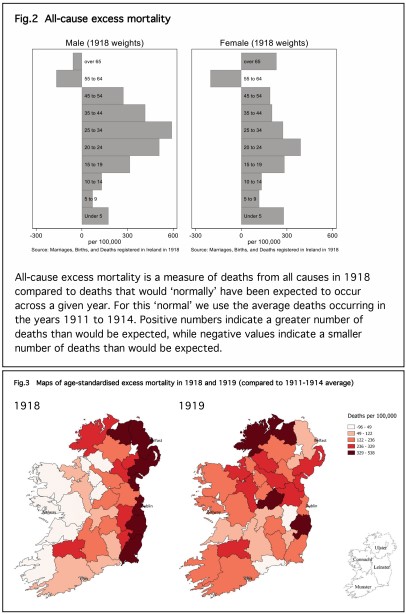
Third, we calculated both age-standardised all-cause excess mortality and age-standardised excess influenza mortality (Fig. 2). These measures take account of the fact that there were prevailing levels of mortality and a prevailing incidence of endemic influenza that pre-dated the pandemic. What we would need to know is how many more deaths there were than we would expect, given this background incidence of disease.
Looking at cause-specific mortality—deaths recorded as being specifically down to influenza and pneumonia—shows a high mortality rate associated with the pandemic. In 1918 there were 16,578 deaths recorded in Ireland, a rate of 386 per 10,000. In 1919 there were 14,672 deaths recorded, 330 per 100,000. When we look at all-cause excess mortality, however, there were only 5,989 more deaths than expected in 1918 and 5,906 in 1919—rates of 163 and 115 per 100,000. Part of the difference is that cause-specific mortality rates are not capturing the effect of the high levels of disease at the time. Life expectancy averaged about 54 years for males and females. Crudely put, influenza was ‘harvesting’ victims from other opportunistic diseases circulating at the time, such as tuberculosis.
Drivers of mortality
What explains the global and sub-national variation in the Spanish ’flu’s mortality burden? Here we postulate that Ireland’s unusual demographic history may be responsible. It is widely known that Ireland is the only country with a smaller population today than it had before the Industrial Revolution, despite persistent rates of natural increase thanks to birth rates being greater than mortality rates. The natural increase in population was cancelled out by Ireland’s patterns of emigration, which is directly relevant to the demography of the pandemic.
Ireland’s emigrants tended to be young individuals, both male and female, rather than family units. The non-migrating residual population was older. This resulted in a variation in age structures throughout Ireland, as regions of the island had different migration experiences. County population growth is negative for all counties except Dublin and Antrim, the locations of Ireland’s two urban centres. Past population change is correlated with influenza- and pneumonia-attributed mortality rates in 1918. Emigration lowered the burden of the pandemic because one of the most at-risk population groups—the 20–40-year-olds—had emigrated (Fig. 3).
Comparing Covid-19 and the 1918-19 influenza pandemic
Pandemics occurring almost 100 years apart are obviously going to draw comparison, but are Covid-19 and the 1918–19 influenza pandemic comparable events in terms of mortality or economic impact? It is still too soon to say, but comparing the age profile of victims of the first wave of Covid-19 with the mortality associated with the Spanish ’flu gives us some clues about how useful such historical analogues will be—or, indeed, how we must adapt our applied history lessons for policy-makers today.
Figure 1 compares deaths by age cohort of the first waves of Spanish ’flu and Covid-19 for the island of Ireland. The most striking feature of the graph is the clear ‘W-shaped’ curve for both sexes in 1918. Meanwhile, the Covid-19 figure looks more like a ‘hockey stick’, with very low mortality rates until the over-65 category. These pandemics affected age cohorts very differently and basing policy-making in 2020/21 on the 1918 pandemic without taking this into consideration may lead to policy mistakes.
One of the most widely cited studies on the 1918 pandemic is Almond’s analysis (Journal of Political Economy 114 (4) (2006)) of the long-term health effects on people who were in utero during the pandemic in the US. The key findings are an increased high-school dropout rate, poverty and later life disability for cohorts exposed to the Spanish ’flu while still developing in their mothers’ wombs. In other words, the pandemic had a long-term scarring effect. Studies like Almond’s have yet to be carried out in the case of Ireland.
Studies such as these open up questions about possible scarring from Covid-19. We already know that the virus has an afterlife in the form of ‘long Covid’. An unintended consequence of current policy-making is the psychological toll that such stringent measures take on society. There is also the issue of scarring of those most vulnerable in society, the young. Time will tell what the impact will be on those who were unable to attend school during important formative years.
Chris Colvin and Eoin McLaughlin lecture in economics and economic history at Queen’s University Belfast and University College Cork respectively.
FURTHER READING
G. Beiner, P. Marsh & I. Milne, ‘Greatest killer of the twentieth century: the Great ’Flu of 1918’, History Ireland 17 (2) (2009).
C.L. Colvin & E. McLaughlin, ‘Death, demography and the denominator: age-adjusted Influenza-18 mortality in Ireland’, Economics and Human Biology 41 (2021).
M. Honingsbaum, Living with enza: the forgotten story of Britain and the great flu pandemic of 1918 (London, 2009).
I. Milne, Stacking the coffins: influenza, war and revolutions in Ireland, 1918–19 (Manchester, 2018).