THE IRISH IN THE 1921 CENSUS OF ENGLAND AND WALES
Published in Issue 3 (May/June 2022), Volume 30By Fiona Fitzsimons
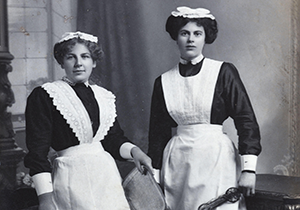
Above: One of the largest groups of Irish women documented in the 1921 census for England and Wales were domestic workers. (Alamy)
A UK census was taken on 19 June 1921, weeks before the Truce ending the Irish War of Independence and six months before the Anglo-Irish Treaty. Political unrest meant that the planned census was not taken in Ireland, although pre-printed forms for the 1921 census of Ireland survive in Kew.
In 1921 the Irish were the largest minority community in England and Wales, followed by the Scots, Russians and Poles. The population of England and Wales was 37,886,699. Of these, 364,747 (0.96%) were born in Ireland. The previous year (1920) the island had been partitioned into two polities and the Irish now enumerated were recorded by jurisdiction: ‘Southern Ireland’, 281,190 (77%); ‘Northern Ireland’, 65,491 (18%); and ‘undefined’, 18,066 (5%). These figures don’t include first- or second-generation immigrants. The Irish in Britain tended to assimilate and didn’t form a distinct political lobby, as in North America.
Two thirds of all Irish migrants in Britain were aged between 11 and 50, most of them employed as adult workers.
| Age | Number | % |
| <10 | 15,466 | 4 |
| 11–20 | 35,199 | 9 |
| 21–30 | 80,094 | 20 |
| 31–40 | 73,518 | 18 |
| 41–50 | 75,702 | 19 |
| 51–60 | 58,961 | 14 |
| >60 | 69,387 | 17 |
Irish migrants to Britain were split almost equally on gender lines – 51% male, 49% female. More than one third were recorded as single, probably reflecting the younger age cohort.
The Irish in Britain came from every part of Ireland. The highest number of immigrants were from the most densely populated counties: Dublin, Cork, Down, Mayo and Antrim. They were economic migrants; they went where the work was. We see higher concentrations of Irish-born men in Lancashire, Cheshire, Southampton, Yorkshire and Devonshire—areas of heavy industry, coal, iron and steel. One of the largest groups of Irish women documented in the census were domestic workers. We find higher concentrations of Irish-born women in London, Surrey, East Sussex and the prosperous Home Counties.
| Marital status | Number | % |
| Single | 130,064 | 38.9 |
| Married | 162,846 | 48.7 |
| Widowed | 41,096 | 12.3 |
| Divorced | 191 | 00.1 |
In 1921 the UK economy was faltering. The threat of industrial action delayed the census from April to June. Consequently, we find Irish in the census that we wouldn’t have found if it had been taken in April—for example, agricultural labourers and other seasonal workers.
The census also documents the Irish in the armed forces, serving in Ireland, Great Britain and overseas (Pieces 28107 to 28153), and the Irish in HM Coastguard Service in Ireland—including officers and other ranks or ratings, their wives and dependent children living in married quarters (Piece 28149).
In 1921 Irish immigration into England and Wales continued to decline, but this was about to change. After 1924, tighter controls on US immigration, and a decline in remittances, meant that Great Britain once again became the main destination for Irish emigrants.
Irish-born population of England and Wales
| Year | % |
| 1851 | 2.9 |
| 1861 | 3.0 |
| 1871 | 2.49 |
| 1881 | 2.16 |
| 1891 | 1.58 |
| 1901 | 1.31 |
| 1911 | 1.04 |
| 1921 | 0.96 |
Earlier this year the 1921 census of England and Wales was published online by Findmypast. The 1921 census of Scotland will be published online later this year by Scotland’s People. In 1926 the Irish Free State and Northern Ireland completed a census, which will be published on 1 January 2027.
Fiona Fitzsimons is a director of Eneclann, a Trinity campus company, and of findmypast Ireland.